

Monitoring
Linux OOM Killer: Find Out What It Killed
A service keeps dying and its own log says nothing. How to confirm the kernel's OOM killer did it, read its log line and stop it coming back on a small server.
By Techie Gain5 min read
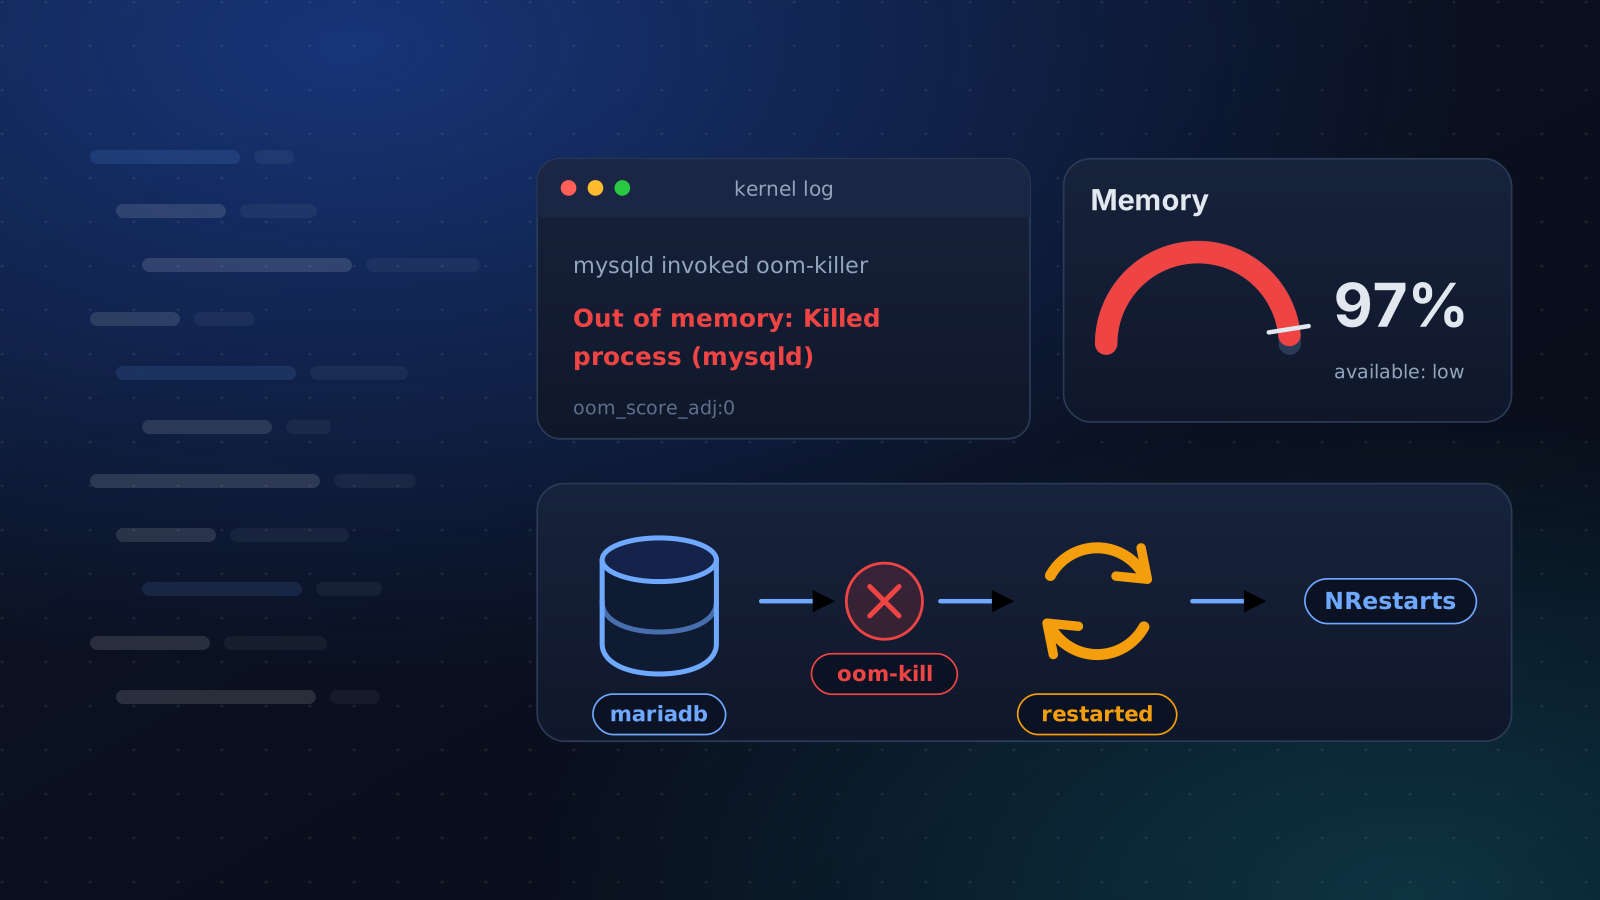
A service stops, its own log ends mid-sentence and nothing says why. When the server is short of memory, the likeliest explanation is the kernel's out-of-memory killer. It ends a process to keep the machine alive and writes only to the kernel log, so the service never gets to record its own death.
We reproduced it in Debian 12 and Ubuntu 24.04 test containers by capping a service at 64 MB. The lines below are what the system printed.
Confirm it was the OOM killer
Ask the kernel log, and check the counter:
bash
sudo journalctl -k -g 'Out of memory|oom-kill' --no-pager
grep oom_kill /proc/vmstat
A non-zero oom_kill means something has been killed since boot. A kill writes a block of lines to the kernel log, and three of them matter. This is the first and the last:
tail invoked oom-killer: gfp_mask=0xcc0(GFP_KERNEL), order=0, oom_score_adj=0
Memory cgroup out of memory: Killed process 23372 (tail) total-vm:68152kB, anon-rss:65280kB, file-rss:1628kB, shmem-rss:0kB, UID:0 pgtables:168kB oom_score_adj:0
The first line names the process that asked for memory when it ran out, which is not always the victim. The last names the victim, with its process ID and anon-rss, the memory it was holding. The prefix says what ran out. "Out of memory" alone means the whole machine did. "Memory cgroup out of memory" means a limit on one service or container was reached while the host still had memory to spare. The line between them, which starts with oom-kill:constraint=, says which kind of limit and, for a group, which one.
After a reboot the kernel log is gone unless journald stores its logs on disk. ls /var/log/journal tells you which you have, and with a persistent journal journalctl -k -b -1 reads the previous boot.
What systemd shows
systemd notices the kill too. systemctl status reports Failed with result 'oom-kill', and the journal adds that a process of the unit was killed by the OOM killer. By default systemd uses OOMPolicy=stop, so one killed process takes the whole service down. We checked with a service running two processes, and both were gone. OOMPolicy=continue keeps the service running instead, and then the only sign is that one journal line. Units that delegate their own cgroup, as container runtimes do, default to continue. On a PHP site a kill like this often reaches visitors as a 502, and the error line nginx logs for it tells a killed worker from a stopped service.
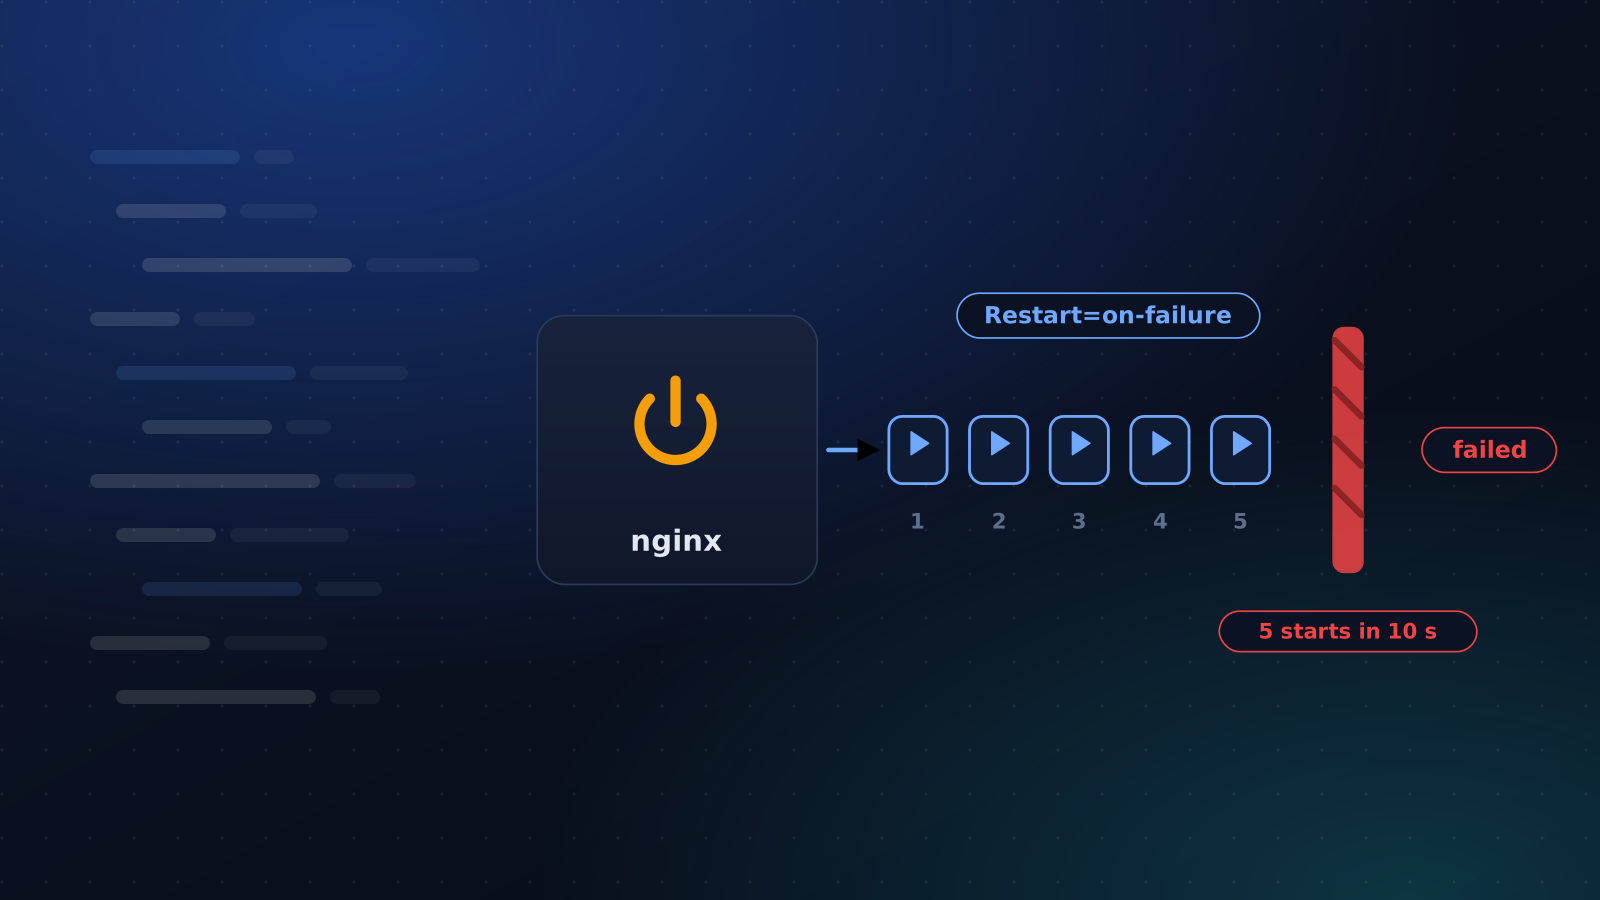
With Restart=on-failure, on-abnormal or always, the service comes straight back. In our test, with a one second delay, it was restarted four times in five seconds. A service that dies every night and returns within seconds looks healthy to anyone who opens the page, so read the counter:
bash
systemctl show mariadb -p NRestartsIn containers
A container with a memory limit hits the same group limit, and Docker records it. This prints OOMKilled=true ExitCode=137 for a container the kernel ended, where 137 is 128 plus signal 9:
bash
docker inspect -f 'OOMKilled={{.State.OOMKilled}} ExitCode={{.State.ExitCode}}' appKubernetes shows the same event as the reason OOMKilled in a pod's last state. Whether the limit was too low or the process grew is still the question to answer.
Why it picked that process
The kernel scores each process, mostly by its share of memory, adds the adjustment in /proc/<pid>/oom_score_adj, which runs from -1000 to 1000, and kills the highest. The biggest process is often the database, which is why MariaDB and MySQL turn up as victims on small servers even when the growth came from somewhere else. See what is large right now:
bash
ps -eo pid,rss,comm --sort=-rss | head -n 8The adjustment is also a lever. A value of -1000 exempts a process, and we confirmed that its score drops to 0. OOMScoreAdjust= sets it for a service. Exempting the one process that is actually growing only moves the kill onto something else, so protect with a smaller negative value where you must, and fix the growth.
Fix the memory, not the killer
Work from the cheapest change to the most expensive.
- Cap what grows. For PHP-FPM, measure a worker and multiply by
pm.max_children. The product has to fit in what is left after the database, the web server and the operating system. - Size the database. For MariaDB and MySQL the biggest setting is
innodb_buffer_pool_size. A buffer pool sized for a larger server is a common reason a small one runs out. - Add a little swap. A swap file can turn a sudden kill into a slowdown and buy time. If
siandsoinvmstat 5stay above zero, the server is swapping constantly and swap is hiding that it is too small. - Fence a runaway.
MemoryMax=in a drop-in confines the kill to one service's group, so a runaway worker pool is stopped before the database is. Runsudo systemctl edit php8.3-fpmand addMemoryMax=1Gunder[Service], using a figure you measured. At the limit the service is killed, and it comes back only if it has aRestart=setting, so treat the limit as a ceiling to stay under. - Buy more memory. If the kills continue after the steps above, the server is too small for its job.
To measure a PHP-FPM worker, use the process name your server runs it under:
bash
ps --no-headers -o rss -C php-fpm8.3 | awk '{s+=$1} END {print s/NR/1024 " MB per worker"}'Notice before the kill
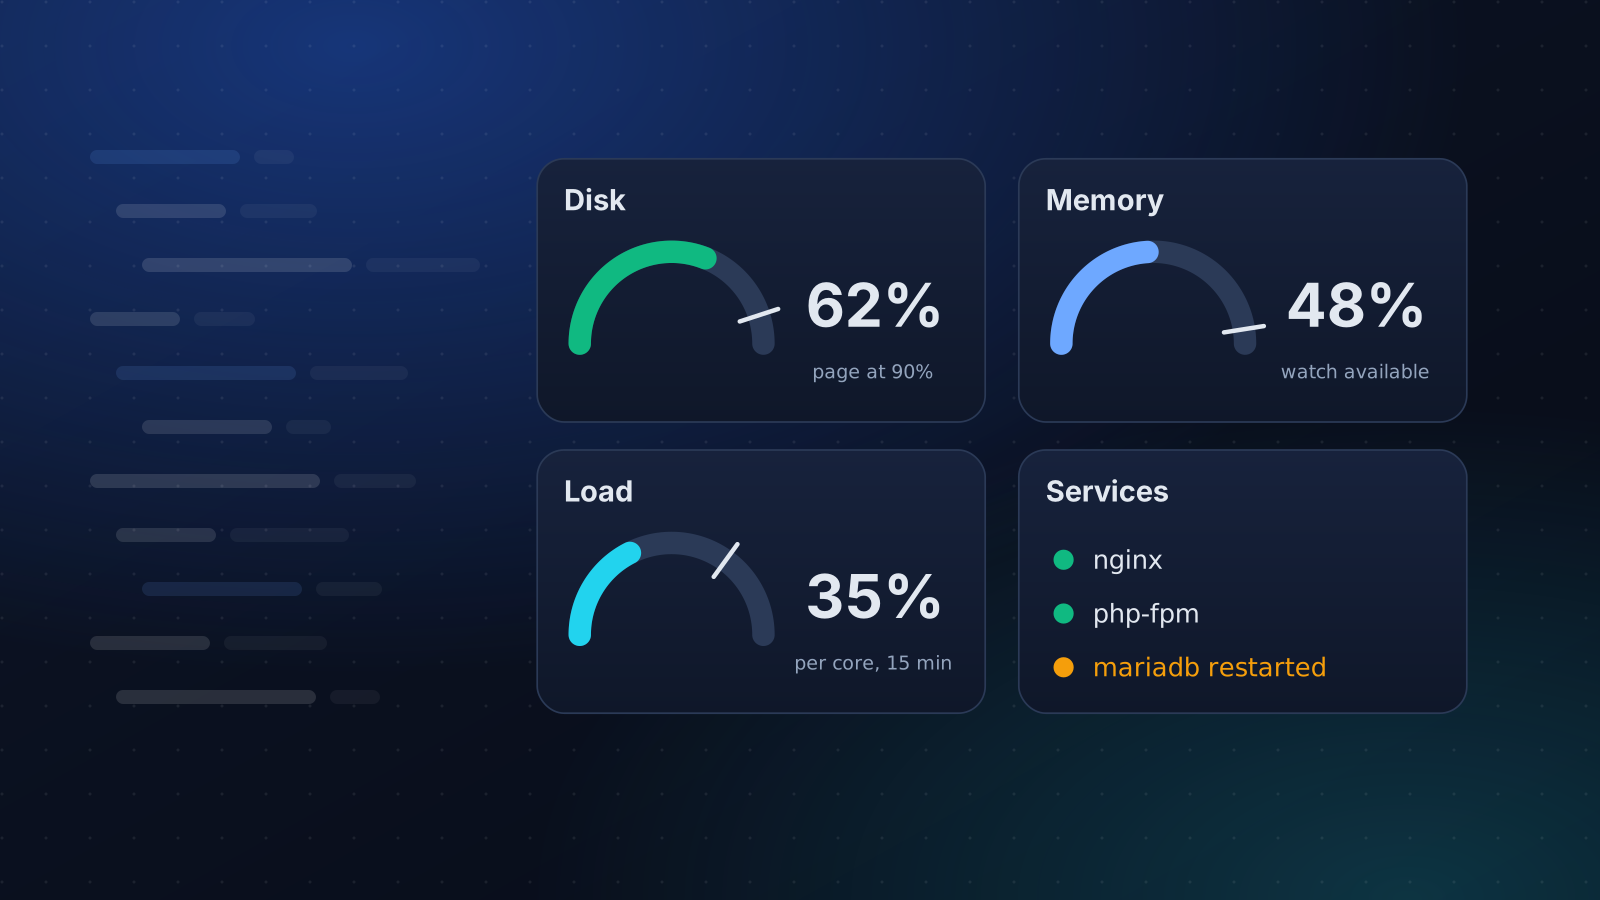
Alert on available memory, not free memory. Linux fills spare RAM with cache, so "free" is nearly always low while "available" is the honest figure. Watch swap activity too, and the oom_kill counter, because a counter that moves is a kill you did not see.
Our own server check alerts by default at 95% of memory in use, with reclaimable cache counted as available. A restart that keeps happening is a symptom, and restarting a crashed service with systemd explains why it must not be the whole answer. For the other thresholds, see what to monitor on a Linux server.
Auto-Fix starts a killed database or web service again after a check fails, and says what it did. It never kills a process or reboots the server, because choosing what to sacrifice is your decision.
Keep reading
Operations
Restart a Crashed Service Automatically With systemd
Two lines make systemd restart a crashed service. Here is the start limit that quietly stops it, the failures it cannot see and how to hear about restarts.
4 min read
Monitoring
What to Monitor on a Linux Server
A short, opinionated list of what to watch on a Linux server, the thresholds worth alerting on, and what to leave out so alerts stay worth reading.
4 min read

Operations
Linux Disk Full: Find What Is Using the Space
df says full, df says free, or the numbers disagree. A calm order of checks for a full Linux disk: inodes, deleted files, journald, Docker and logs.
4 min read