

Monitoring
What to Monitor on a Linux Server
A short, opinionated list of what to watch on a Linux server, the thresholds worth alerting on, and what to leave out so alerts stay worth reading.
By Techie Gain4 min read
Every alert should survive one question: would I get out of bed for this? If the answer is no, it belongs on a dashboard or in a weekly email, not in the channel that wakes you up. Most monitoring setups go wrong because they were built by asking "what can we measure?" instead.
Here is the list we would start a new server with, in the order we would add it.
Start from the outside
The check with the highest value is a request for a real page that touches the database, from outside your network, with a phrase it must contain. It covers DNS, the network, the web server, the application and the database in one go, and it is the only check that fails the way a visitor's experience fails.
After that come the things people forget because browsers never complain about them:
- Certificate expiry on every TLS port, mail and database included. Warn at 14 days for certificates that renew themselves and at 30 for ones a person renews.
- Domain expiry. A lapsed domain takes everything down and no restart will bring it back.
- TCP reachability for services that are not HTTP, such as SMTP.
- DNS records that should never change.
Then four things inside the machine
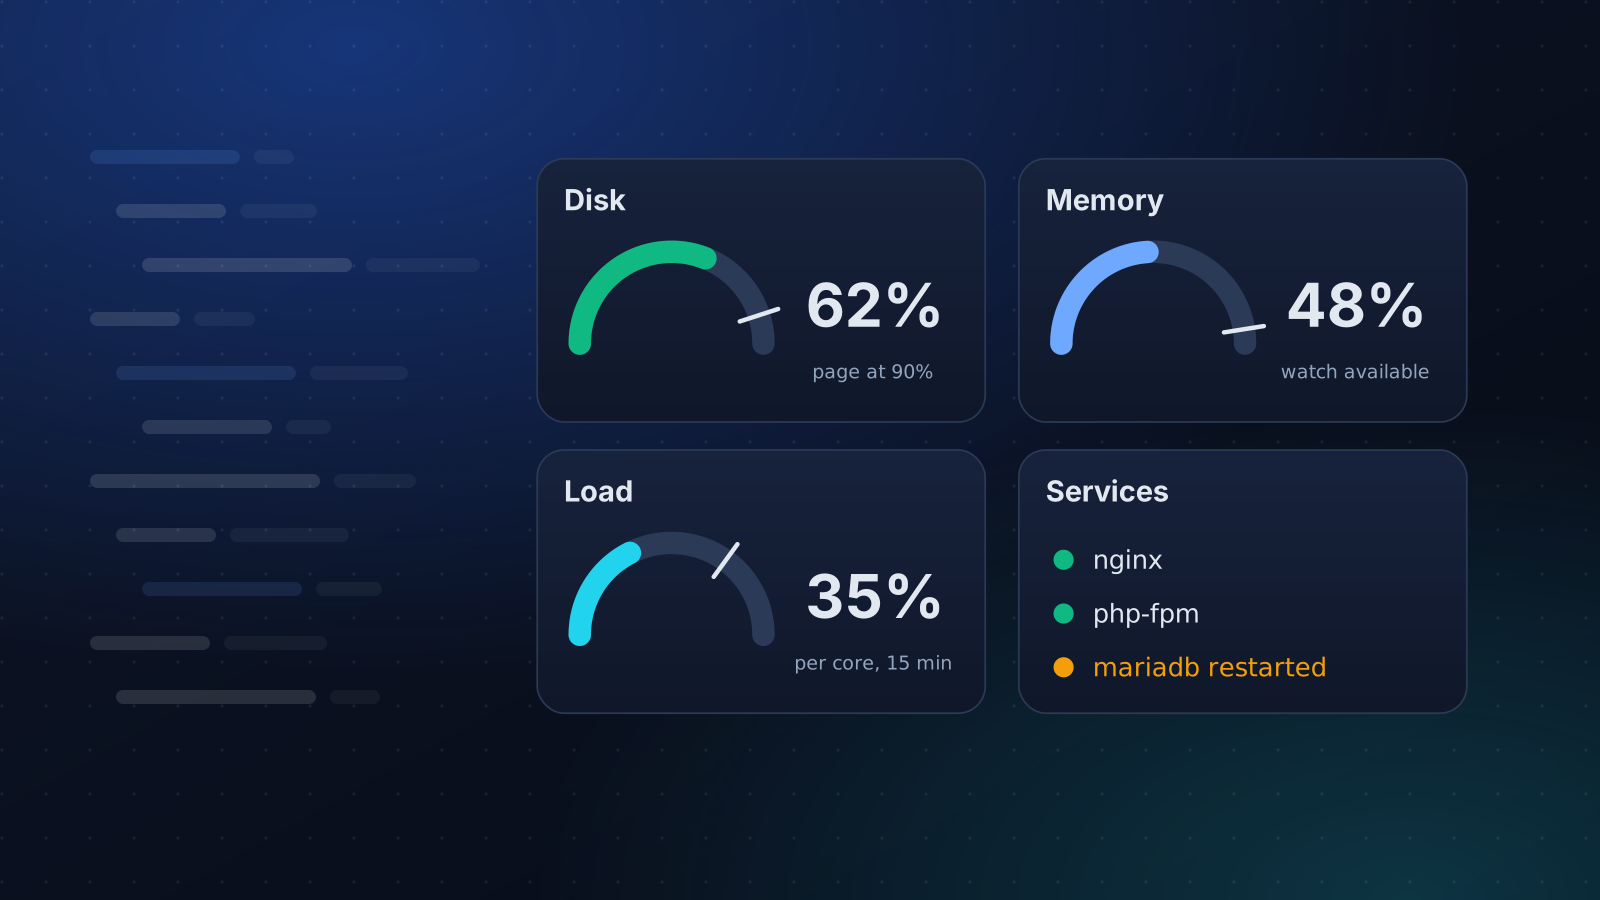
| Watch | Alert when | Why that number |
|---|---|---|
| Disk | Used above 90%, or only a few GB free on a very large volume | Full disks fail in ugly, unrelated ways. Percentages mislead on big volumes, so add a floor |
| Memory | Available memory is low and swap keeps climbing | Linux spends spare RAM on cache, so "used" is always high. Available is the honest figure |
| Load | 15 minute load per core above 2 to 4, sustained | One minute load is noise, and it means nothing until you divide by the cores |
| Services | A unit you care about is not active | systemctl --failed should be empty |
Our own server health check starts at 90% disk, 95% memory and a load of 4 per core, and ships with CPU alerts off. That last choice is deliberate and worth copying.
What to leave out
CPU percentage. A backup, an image resize and a cron job each push it to 100% for a minute and nobody is harmed. Alert on load sustained over a quarter of an hour, or on response times, which is what a busy CPU actually damages.
Per-process thresholds. They produce a page for every deploy.
Anything you have snoozed three times. Either the threshold is wrong or the alert should not exist. Fix it, delete it, or move it to a digest.
Two levels, not one
A single severity trains people to ignore everything. Use two. Pages are for things a visitor already feels: the site is down, a certificate has expired, the disk is full. Everything else goes to email or a chat channel and is read at a desk: disk at 80%, a service that restarted itself, a certificate with three weeks left.
Check the checker
A monitor that lives on the server it watches goes quiet exactly when you need it. If samples stop arriving, that is an alert in itself, and "the server is unreachable" and "our collector broke" are not the same message. Ours asks the server directly over SSH when its samples go stale, so a collector problem does not report every server as down at once.
Let something fix the boring ones
Most disk and service alerts have a boring cause and a safe fix: restart the stopped service, clear the package cache, trim the journal. Doing that automatically, and still telling you what it did, turns a page into a line in a daily digest. That is what Auto-Fix is for, and it deliberately never reboots a server, deletes your data or touches firewall rules.
When one alert keeps coming back, fix the cause. Find what is filling the disk, or make the service restart itself, and keep the alert for the cases the automatic fix cannot handle. If the alerts that reach you are mostly wrong, start with why monitors send false alerts.
Write the reason next to the number
A threshold without a reason is a guess, and the person reading it at 3 a.m. is not the person who chose it. Put one sentence with every alert: what usually causes it, what to look at first and which fix is safe. "Disk 91% on /var" is half an alert. "Disk 91% on /var, usually the journal or Docker logs, safe fix is the cleanup playbook" is one somebody can act on half asleep.
A starting set
If you want the shortest version, it is this. One page check with a phrase. Certificate expiry. Disk, memory, load and failed services, each with a threshold you wrote down and a reason. Two severity levels. Review it after a month, delete whatever never mattered, and be honest about what woke you up and should not have.
Keep reading
Monitoring
Why Your Uptime Monitor Sends False Alerts
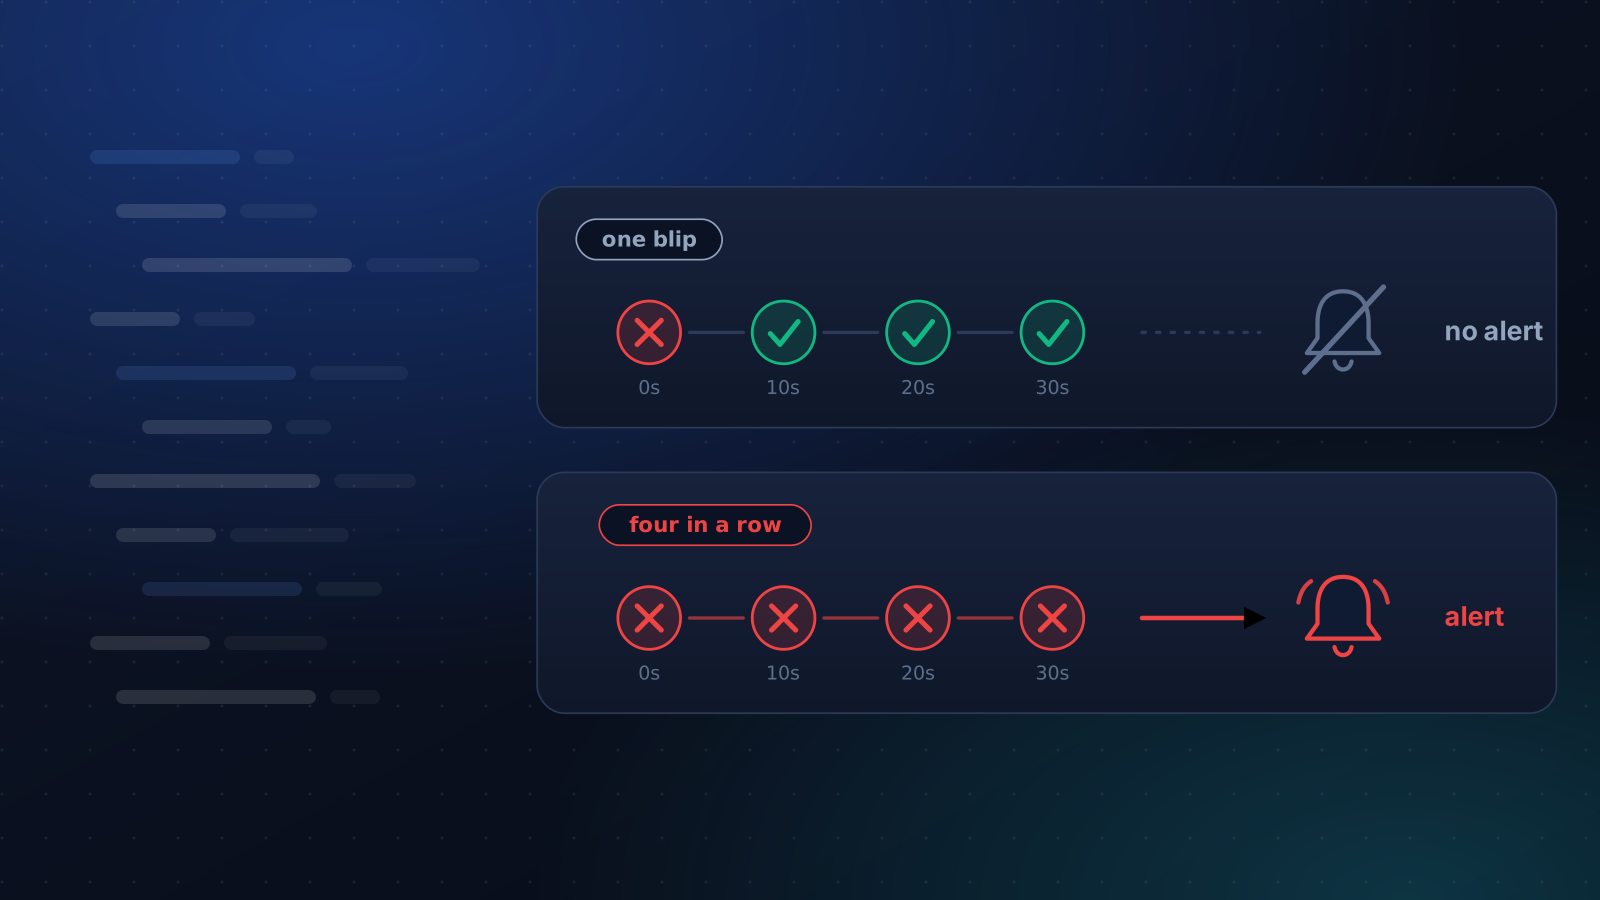
Your monitor says the site is down and it is fine. The usual causes, how to tell which one you have, and how to cut the noise without going blind.
4 min read
Operations
Linux Disk Full: Find What Is Using the Space
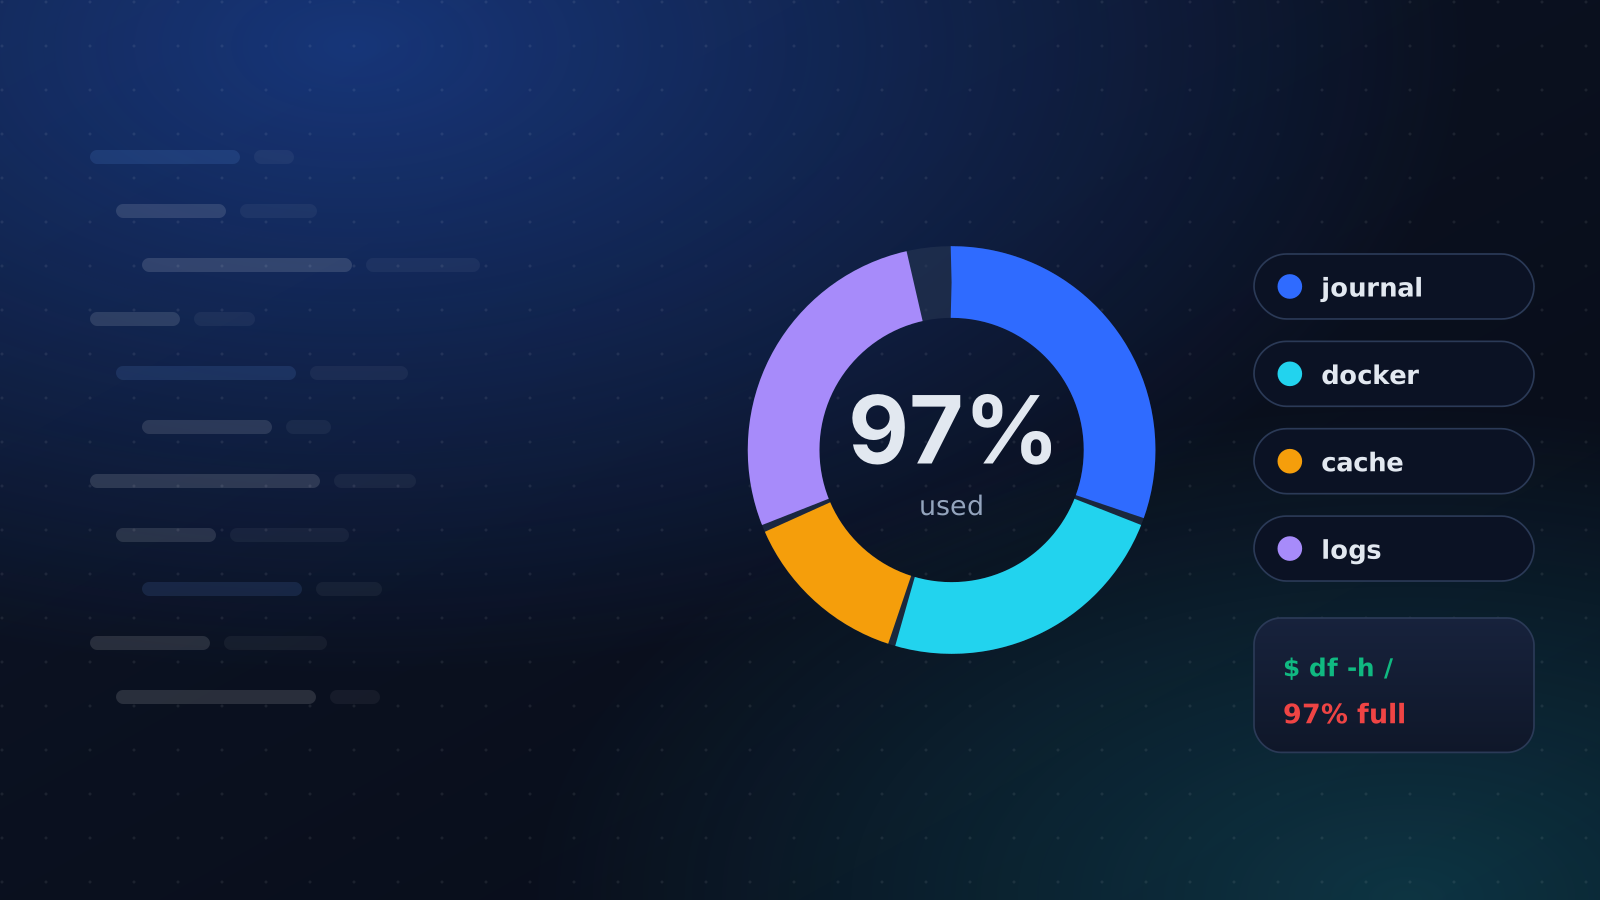
df says full, df says free, or the numbers disagree. A calm order of checks for a full Linux disk: inodes, deleted files, journald, Docker and logs.
4 min read
Operations
Restart a Crashed Service Automatically With systemd
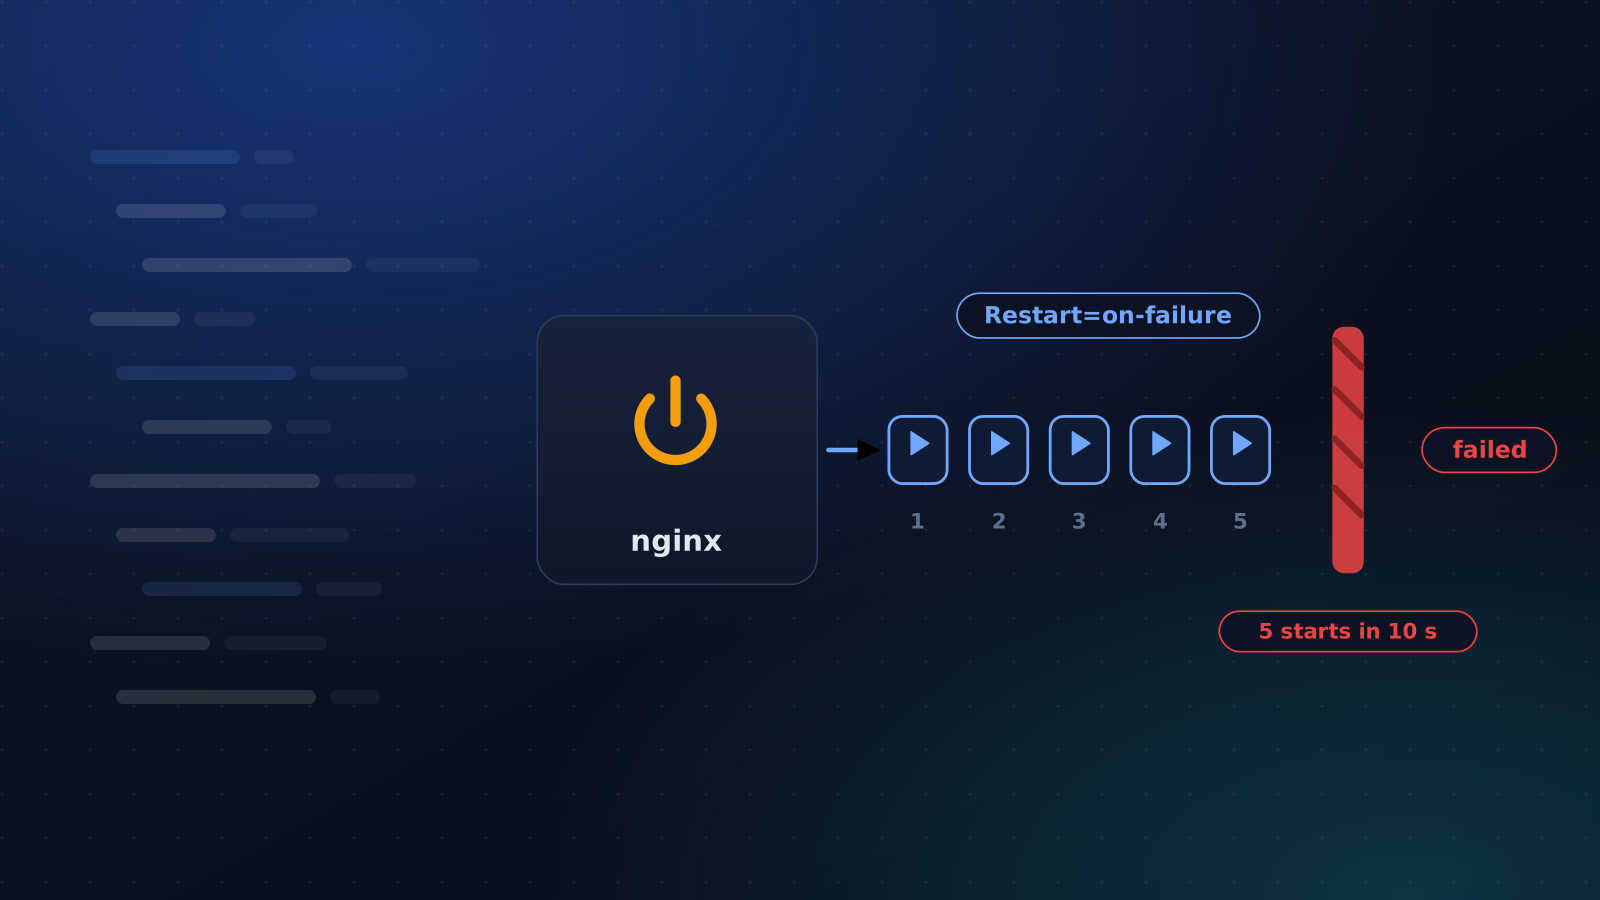
Two lines make systemd restart a crashed service. Here is the start limit that quietly stops it, the failures it cannot see and how to hear about restarts.
4 min read