

Monitoring
Why Your Uptime Monitor Sends False Alerts
Your monitor says the site is down and it is fine. The usual causes, how to tell which one you have, and how to cut the noise without going blind.
By Techie Gain4 min read
Nothing wears down trust in alerting faster than a 3 a.m. email about a site that is perfectly healthy. After the third one people stop reading them, and the fourth is the real outage.
The monitor is rarely broken. It is usually seeing something true that is not an outage: a block, a timeout set too tight, a single lost packet, or a page that answered correctly with the wrong status. Each has a different fix, so the first job is telling them apart.
Ask for the page the way the monitor does
From a machine outside your network, not from the server itself:
bash
curl -sS -o /dev/null -w '%{http_code} %{time_total}s %{remote_ip}\n' https://shop.example.com/You get the status code, how long the answer took and which address replied. Run it a few times. If it prints 200 in a fraction of a second every time, the problem is on the monitor's side of the path, or it only happens to monitors. Add -4 or -6 to force one address family. A site with an AAAA record that points at nothing works for most visitors, because browsers fall back to IPv4, and can fail for a monitor that does not.
Where the monitor runs matters
A monitor on the server it watches goes down with it, and a monitor in the same data centre shares its network problems. The useful signal comes from somewhere a visitor could be.
That is also why "the process is running" is a weak substitute for asking for the page. The process can be running while it serves errors, sits behind a broken proxy or presents an expired certificate. For anything that matters, request a page that touches the database and require a phrase that only appears when it worked.
When something is blocking it
This is the most common cause on sites behind a CDN, a firewall plugin or a server-level rule set. Monitors connect from data centre addresses with a user agent that names a monitoring service, which is exactly what bot filters are written to stop. People get the site. The monitor gets a 403, a 429 or a challenge page.
There are two fixes. Allow the monitor's addresses in the firewall or CDN rules, if the vendor publishes them. Or send a request that looks like a browser's. We took the second route in our own monitor after ModSecurity and CSF rule sets scored an honest "monitoring agent" user agent as a bot. Whichever you choose, add a phrase check, so that a challenge page cannot pass for your home page.
When the timeout is the problem
A timeout is a policy, not a measurement. Set it at ten seconds and every slow query on a busy WordPress site becomes an outage. Set it at 30 and you still miss the page that needs 31 on a cold cache.
We learned this on a shared-hosting WordPress site that answered correctly and slowly. An earlier version of our monitor, with a 30 second timeout, emailed "down" about a site that was up. Our rule now is that a response inside 45 seconds counts as up, and one slower than 15 seconds is marked slow and never alerts.
Whether that is the right trade for you depends on the site, but make it on purpose. How long a visitor will wait is a product question. How long before something is broken is an infrastructure question. Monitors tend to blur the two.
When it was one bad check
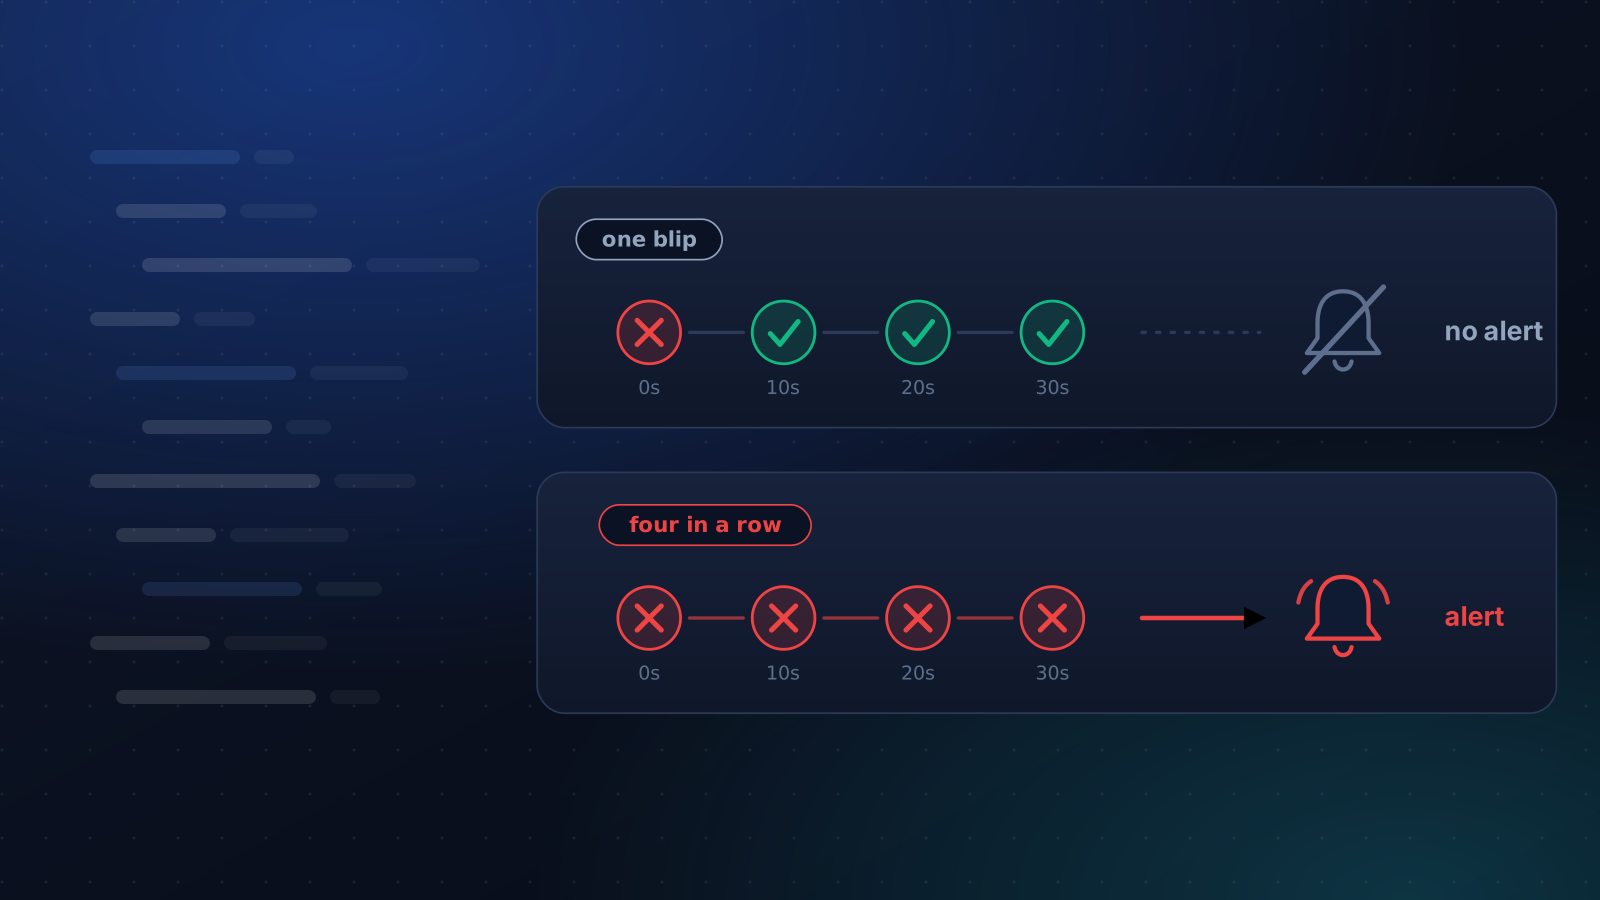
Single probes lose packets. Resolvers hiccup. A deploy restarts PHP-FPM for two seconds. One failed check is a sample, not an outage.
Requiring several failures in a row, a few seconds apart, removes nearly all of that for the price of a short delay. Ours needs four failed checks ten seconds apart. A server that refuses connections is confirmed in about half a minute. One that hangs takes a few minutes, because each failed check waits out its full timeout. Recovery goes the other way: a single success closes the incident, since nobody should wait to hear that it is over.
If your tool checks from several locations, require agreement between them. One region failing while the others pass points at the network near that probe.
When the page really did answer wrongly
Some of the alerts that get called false are not.
- A maintenance plugin returns 503 on purpose, and the monitor believes it.
- A site redirects HTTP to HTTPS and the monitor expects 200. Some tools follow redirects and some, ours included, report the redirect so that a surprise one stays visible. Point the monitor at the final address.
- A certificate expired, and browsers that were clicked through still show the page.
- Somebody edited the footer, and the phrase the monitor looks for is gone.
Each of those is a true alert about something you did not think of as an outage. Decide, for each one, whether it should wake someone.
Test the monitor like anything else
Stop nginx on a staging server and time the alert. Start it again and time the recovery. If you do not know those two numbers, you do not know what your monitoring does.
Our website monitoring works the way this post describes, and Auto-Fix can try a safe repair before an alert is sent. For the wider list of things worth watching, see what to monitor on a Linux server.
Keep reading
Monitoring
What to Monitor on a Linux Server
A short, opinionated list of what to watch on a Linux server, the thresholds worth alerting on, and what to leave out so alerts stay worth reading.
4 min read
Security
Certbot Renewal Failed? Find the Cause
Certbot renewals fail weeks after issuance, when nobody is looking. How to read the error, the causes behind most failures, and how to hear about it in time.
4 min read
Operations
Restart a Crashed Service Automatically With systemd
Two lines make systemd restart a crashed service. Here is the start limit that quietly stops it, the failures it cannot see and how to hear about restarts.
4 min read